Macro Pixel Sub-Assembly (MaPSA) Probe Testing
The Macro Pixel Sub-Assembly (MaPSA) is the bump bonded assembly of the pixelated PS-p sensor and the MPA (Macro Pixel ASIC) readout chip. The PS modules contain a strip sensor on the top layer and a the pixelated strip sensor on the bottom layer. This will require sixteen MPA chips (each with a size of 12 mm x 26mm and containing 1918 bumps) to be connected to a single large area sensor piece.
Details about the MaPSA
- 2x8 MPA chips
- 1 PS-p sensor per assembly
- Pixels are on a 1446x200 μm pitch
- 200 μm pitch is staggered (effective 283 μm pitch)
- From the first wirebond pad of 1 MPA to the next MPA first wirebond pad is 12mm.
Important - MPA chips have 118 wirebond pads on 100 micron pitch.
- Each pad has a 100x70 micron region for probe testing.
Setting things up
- Turn on the wall air
- Located in the back of the prober, the second handle.
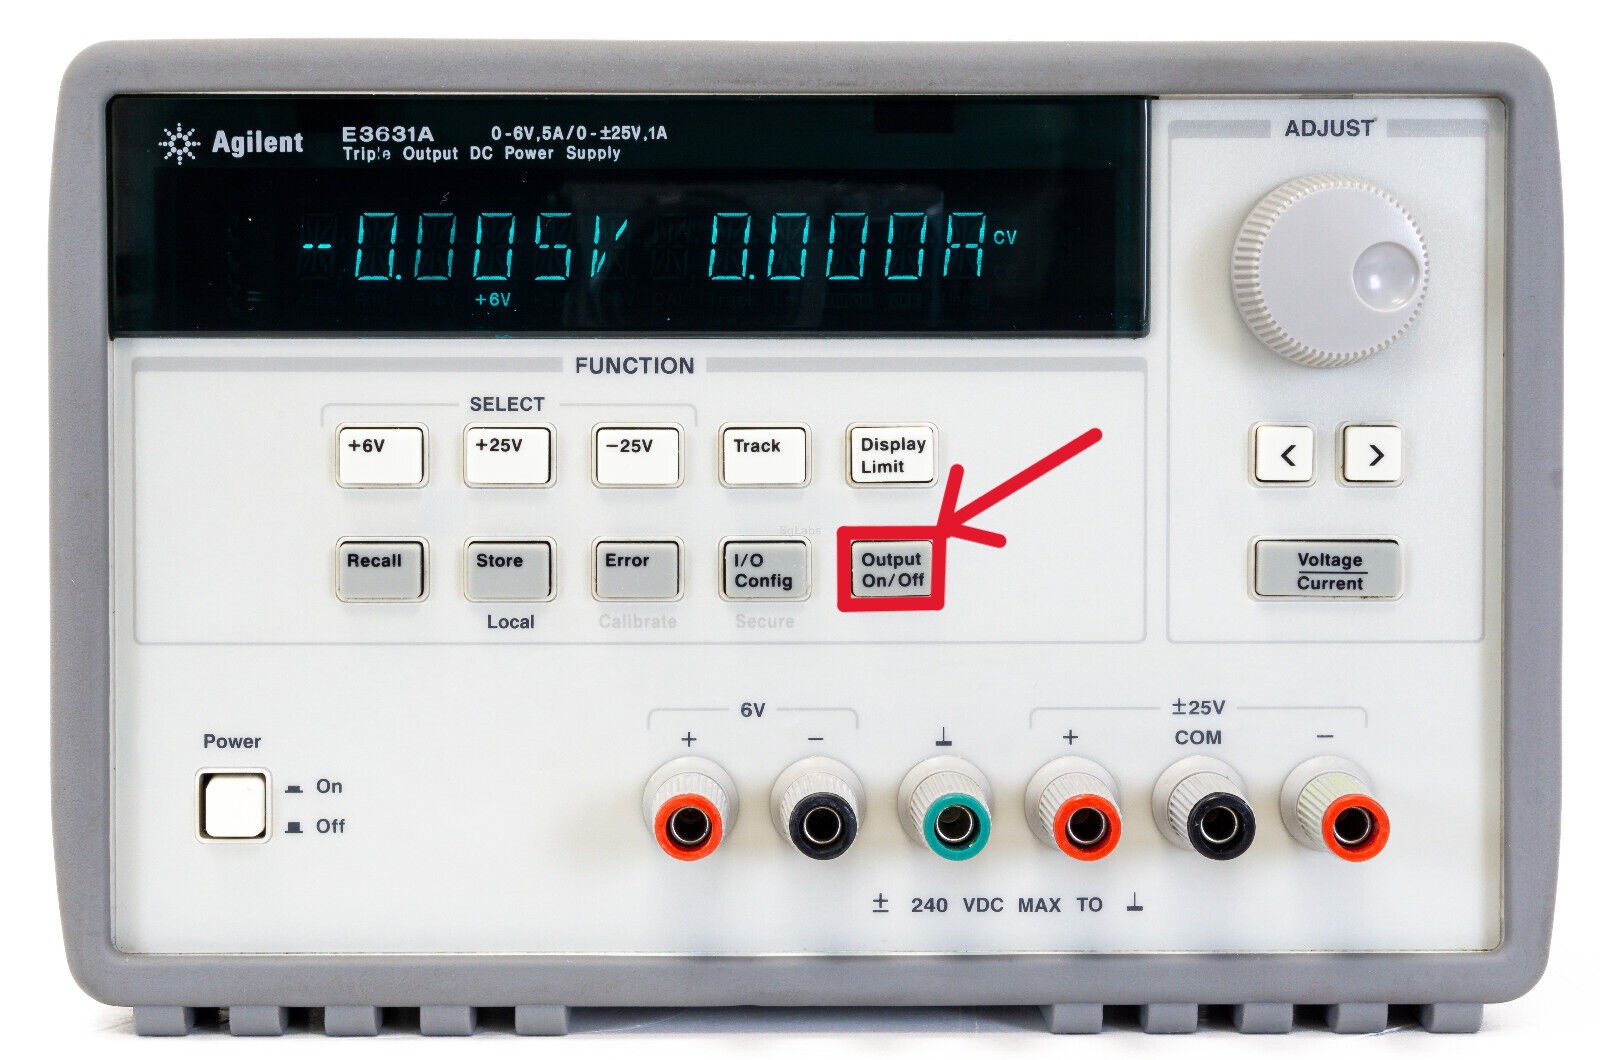
Power Supply
Turn only the Output
- Press the green button of the Tesla Prober
- This is to initialize the Prober
- Inside the Prober, check if the Probe Card is on
- It has a red LED indicator
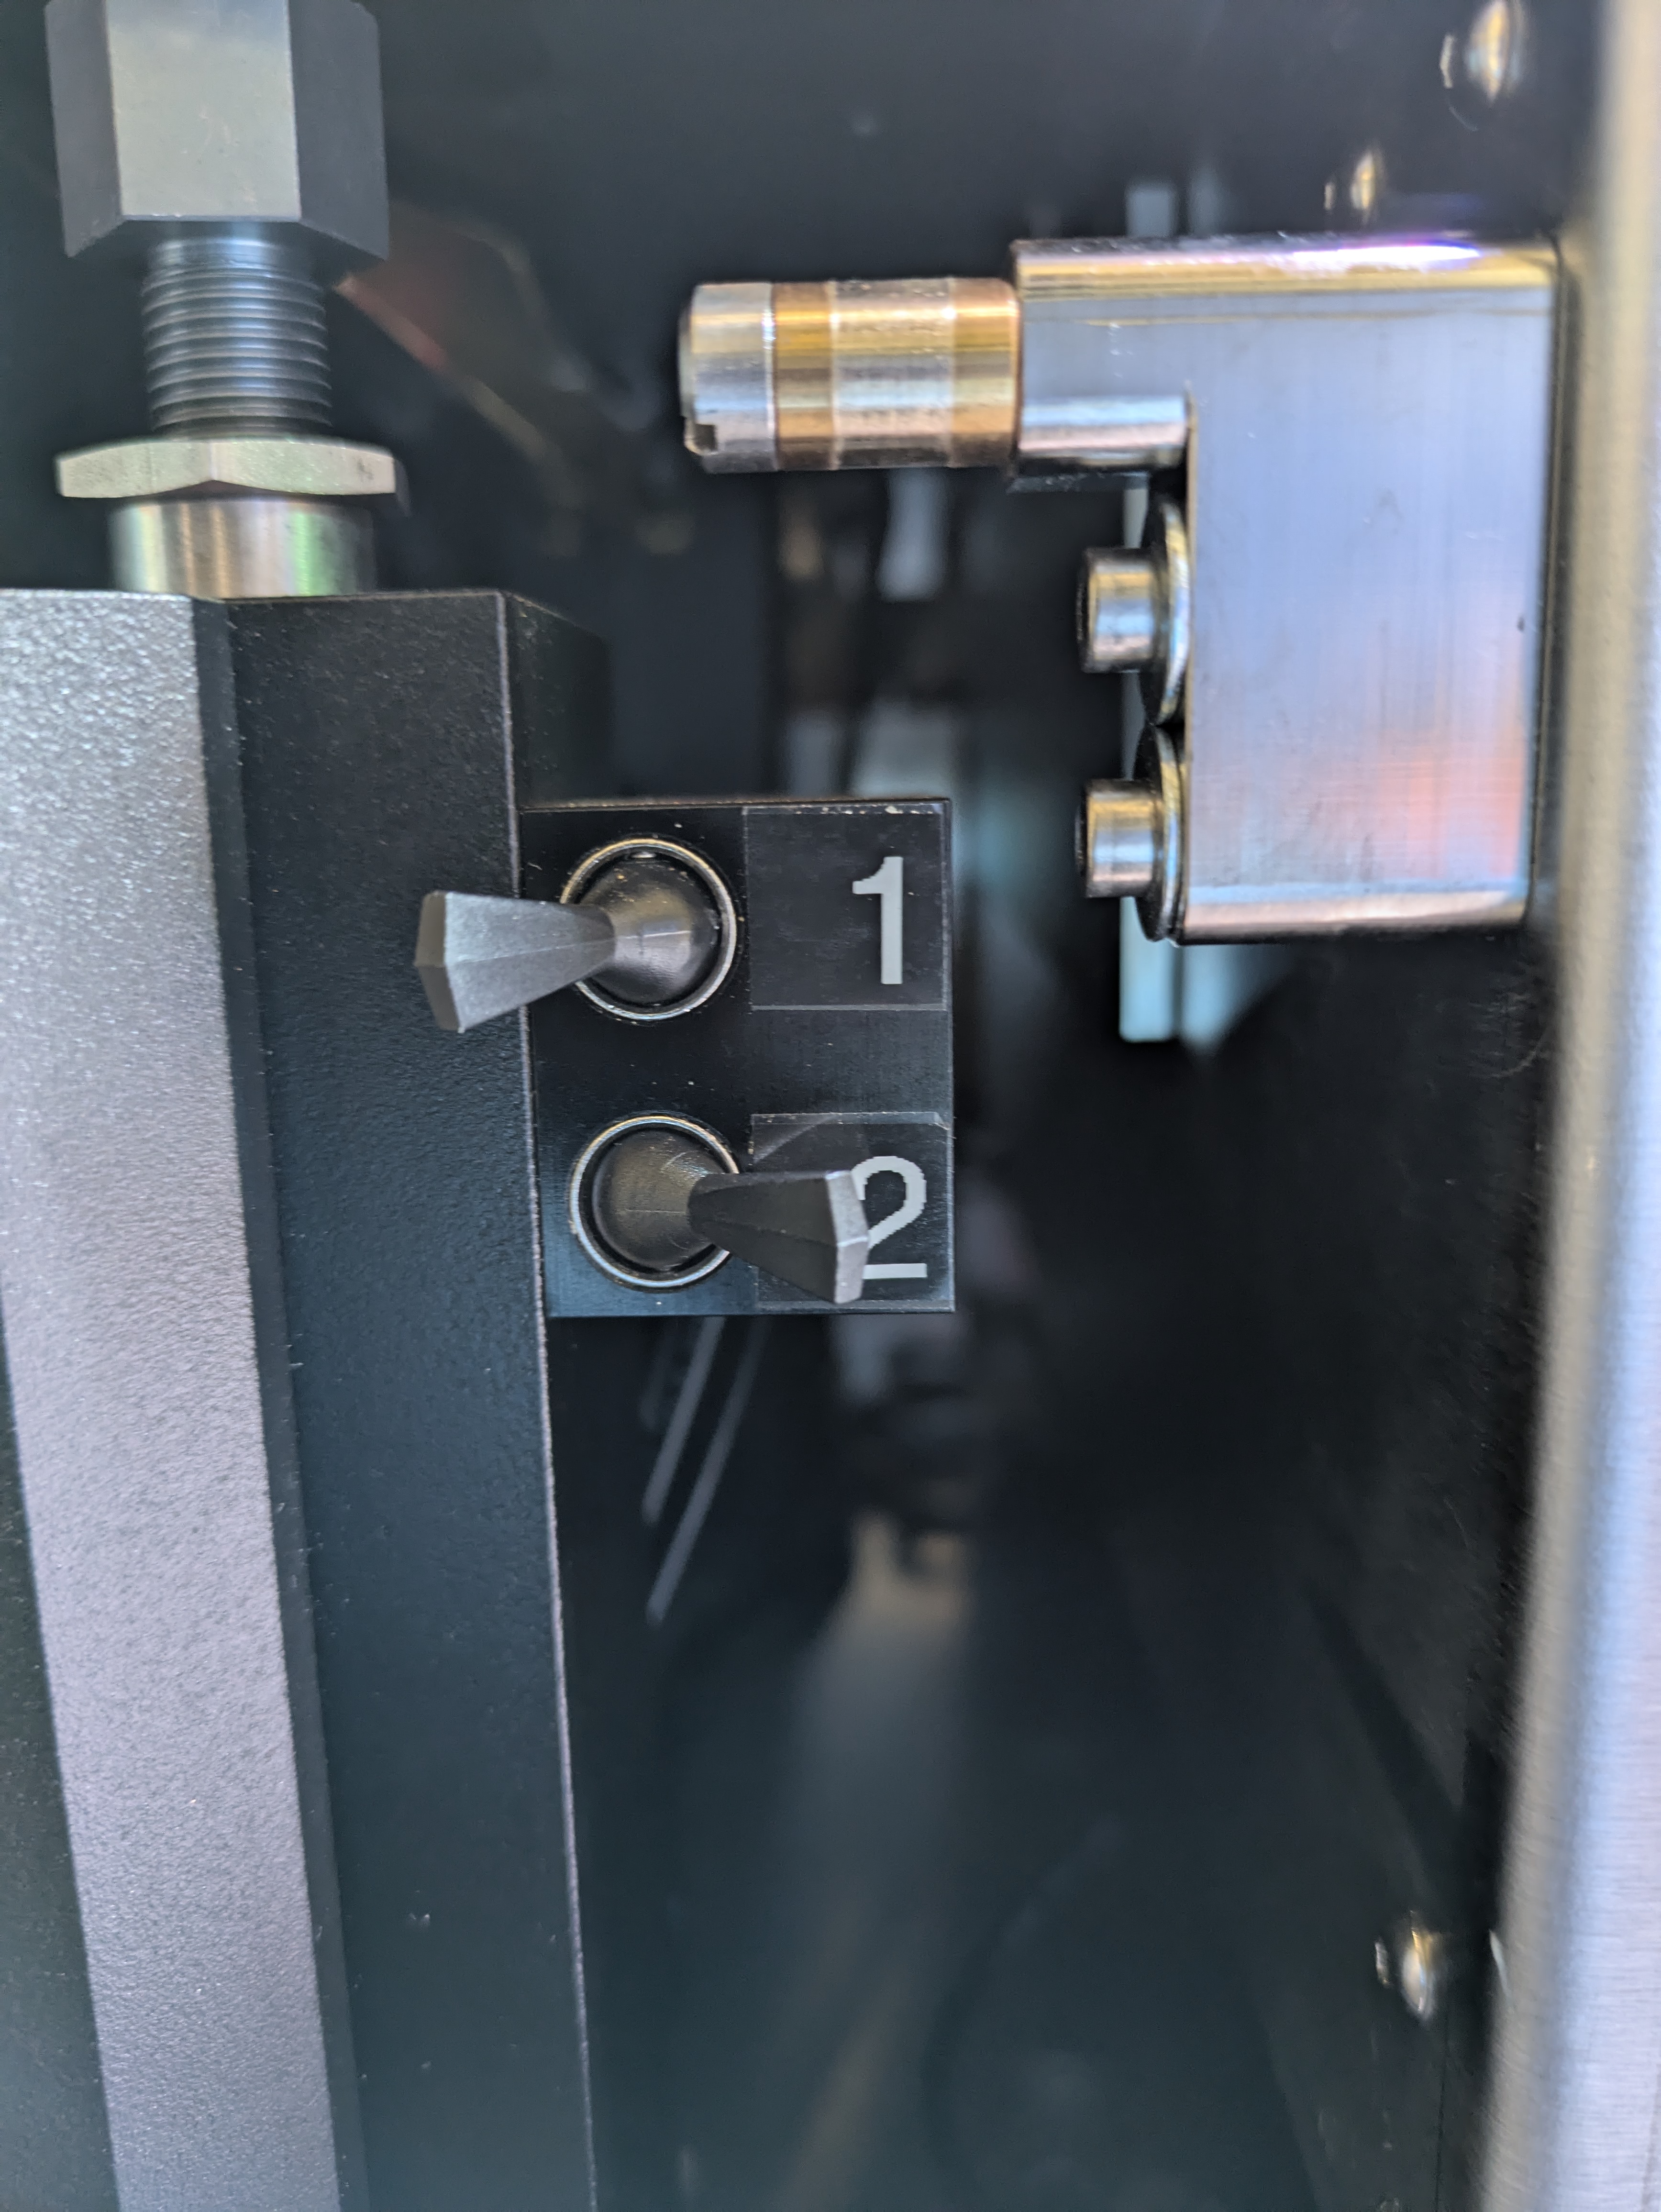
- Turn on the FC7 by turning the switch towards the user
Setting up the GUI
- Connect to the FC7
- Ethernet Connection named
enp2s0
- Ethernet Connection named
-
If the terminal is not on root:-
  cd Documents/MaPSA/MaPSA_Testing/Ph2_ACF
  su //This requires a password, ask supervisor
  source setup.sh
-
- Initialize the FC7 and Probe Card
-
fpgaconfig -c settings/MaPSAstation.xml -i uDTC_MPA_SEU_Dev_PM.bin
fpgaconfig -c settings/MaPSAstation.xml -l
-
- Run the GUI
-
cd MPA2_Testing/MPA2_Test/
./start_minigui_mpa.sh
-
- On the terminal its going to output:
IP=192.168.0.8
______________________________________________________
             Starting MPA2 Test System


PING 192.168.0.8 (192.168.0.8) 56(84) bytes of data.
64 bytes from 192.168.0.8: icmp_seq=1 ttl=64 time=0.058 ms

--- 192.168.0.8 ping statistics ---
1 packets transmitted, 1 received, 0% packet loss, time 0ms
rtt min/avg/max/mdev = 0.058/0.058/0.058/0.000 ms
=>  MPA Testbench correctly found at address 192.168.0.8
=>  Loading scripts
->  Board Selected MAC > 08:00:30:00:29:61 IP > 192.168.0.8
->  Loaded configuration for MPA
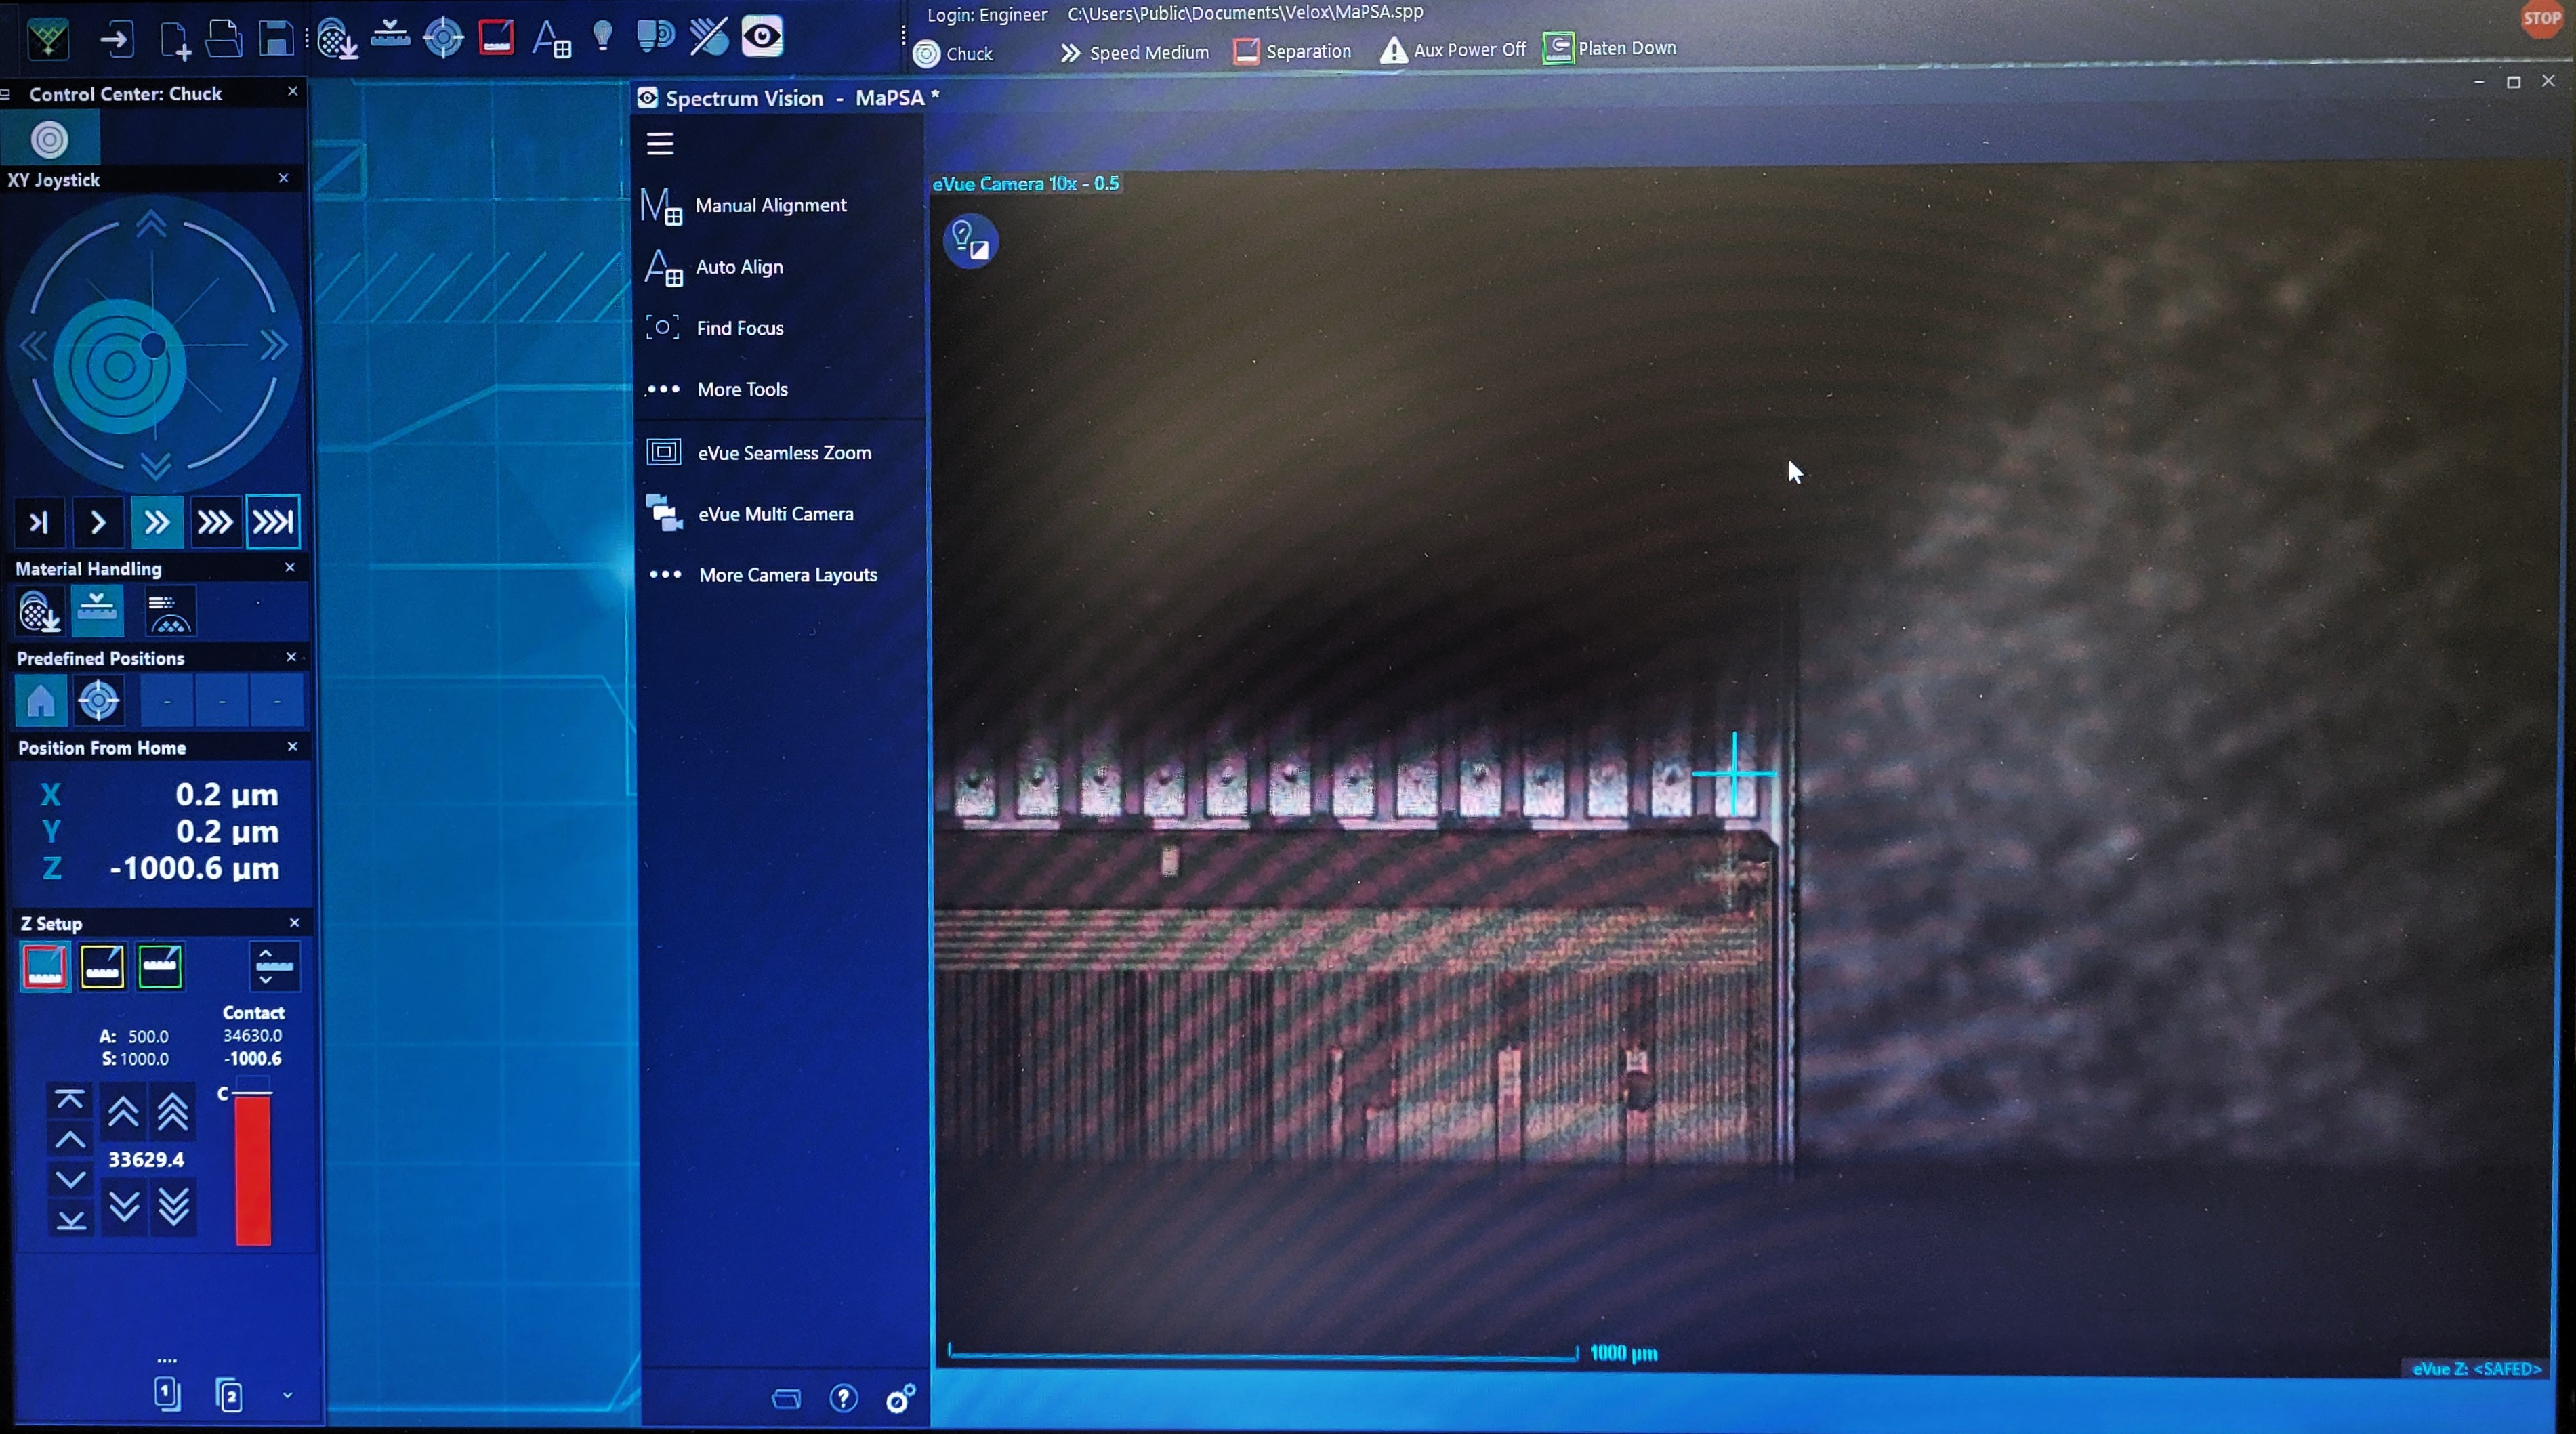
- When the GUI launches it should look like this:
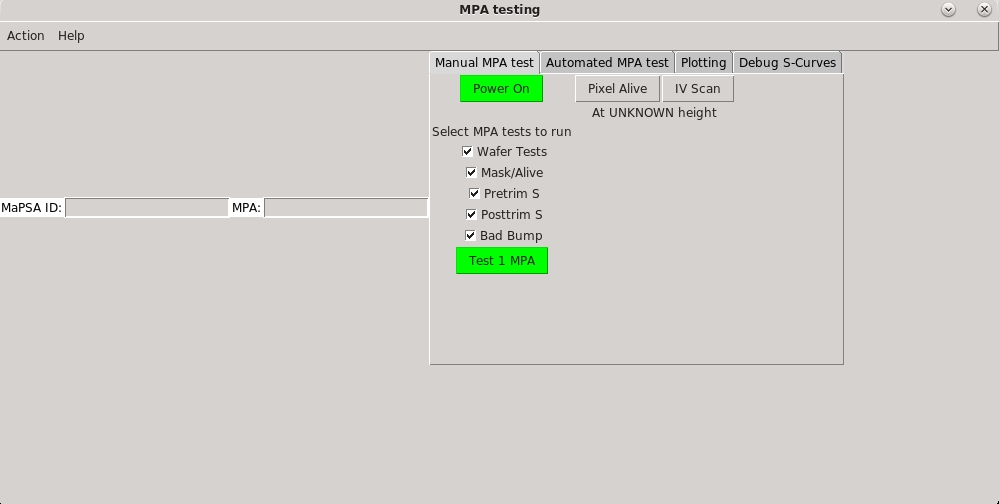
MaPSA Test
Step 1: Take the MaPSA
- Take the MaPSA out of the dry box
- Open the compartment of the prober
The most reliable way to check the first MPA is by turning the MaPSA around and check the PS for this corner:
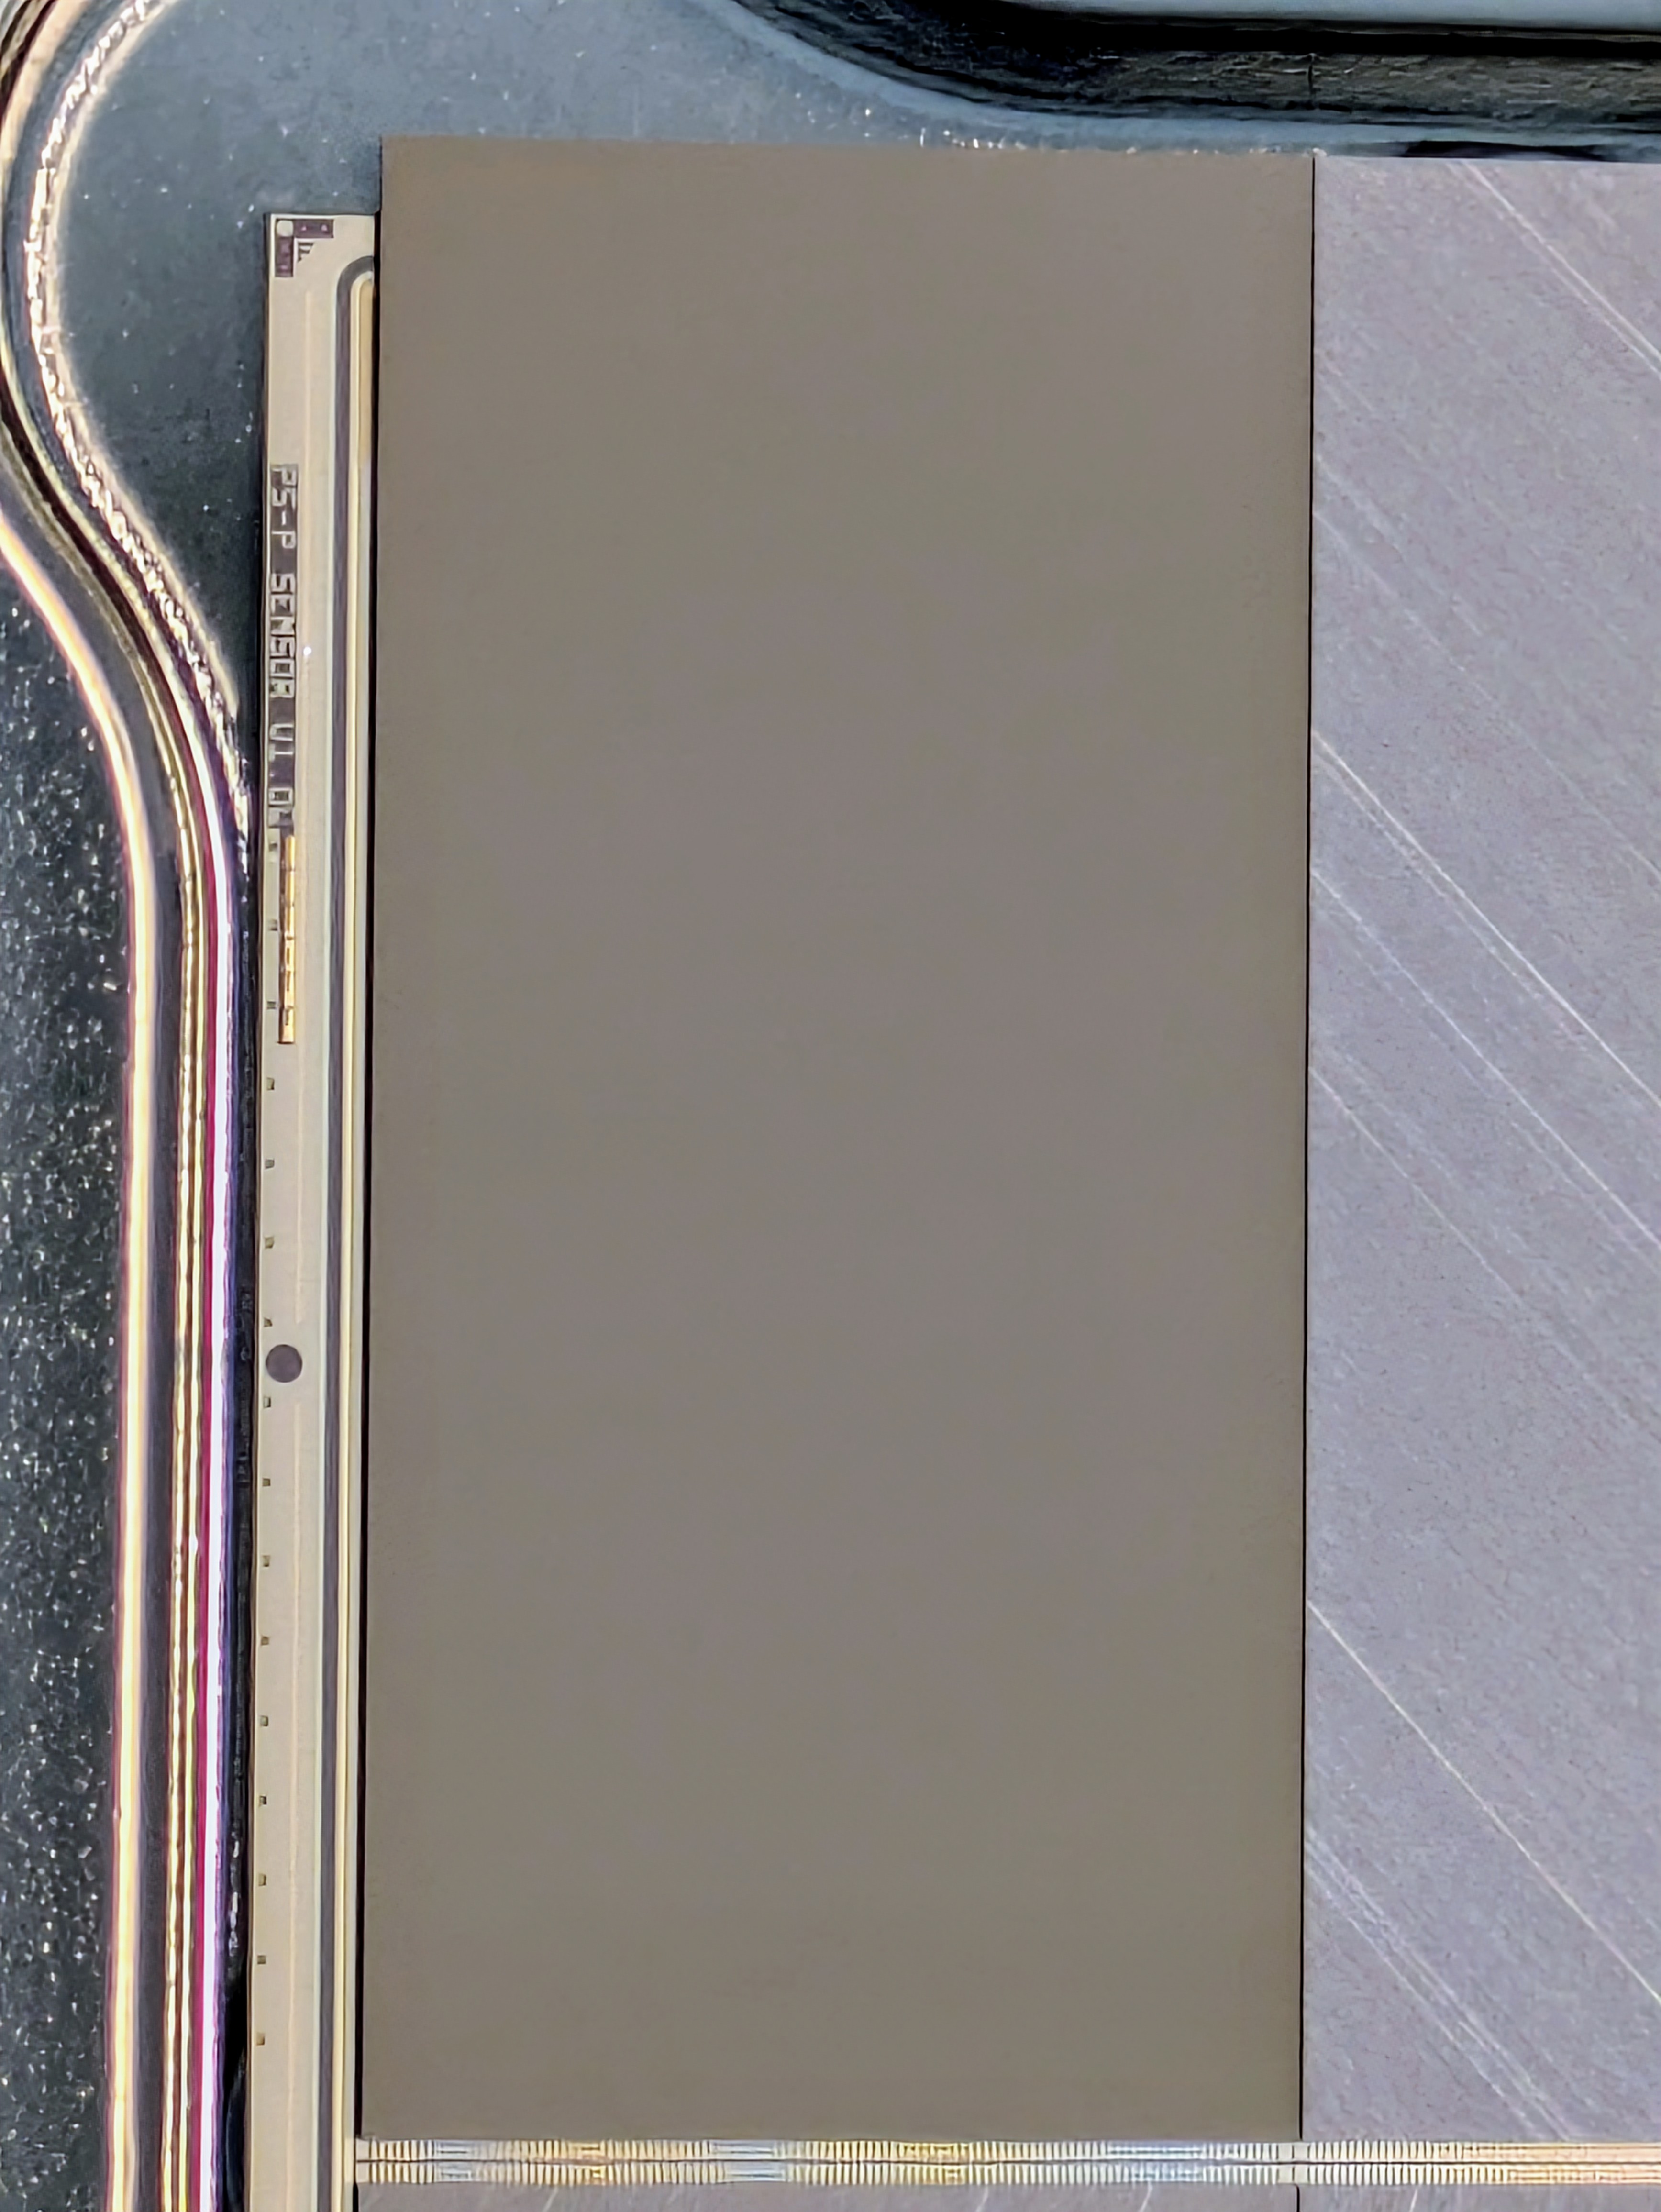
Or:
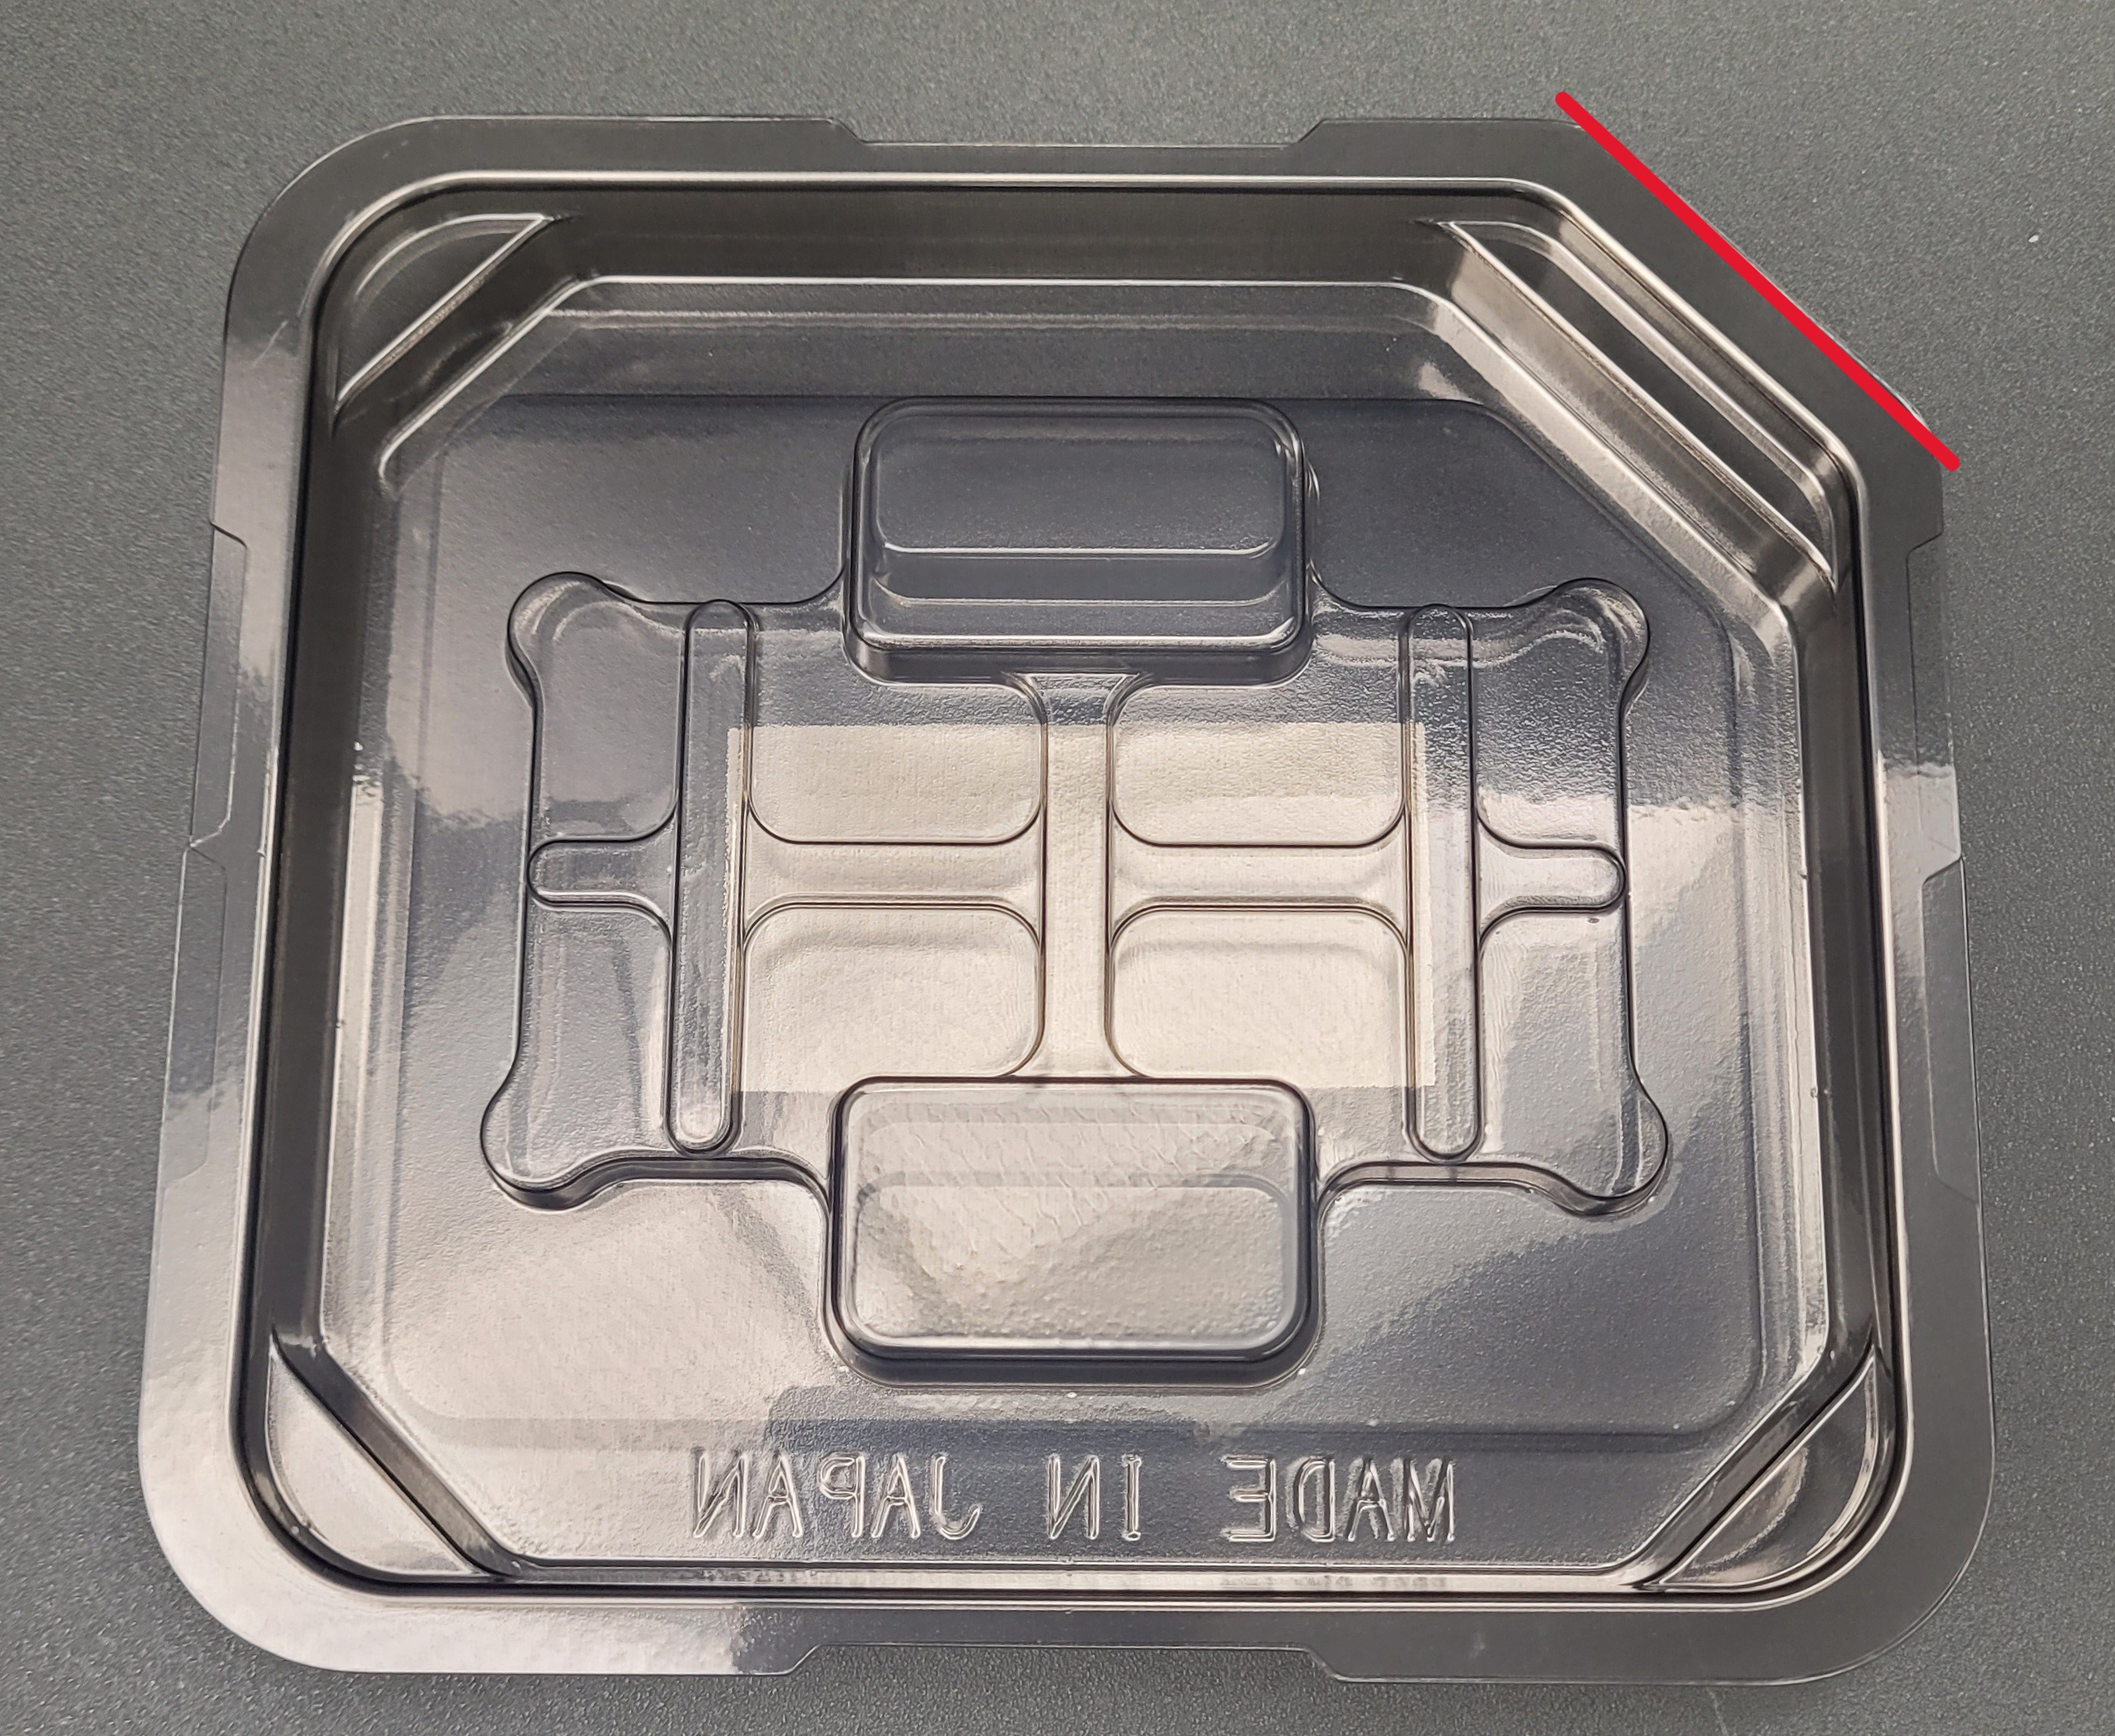
- Turn around the MaPSA box and locate a flat corner in the box
- IF its Hamamatsu (this will be explained in Step:6)
- This flat corner locates the First MPA of the MaPSA
Step 2: Placing the MaPSA
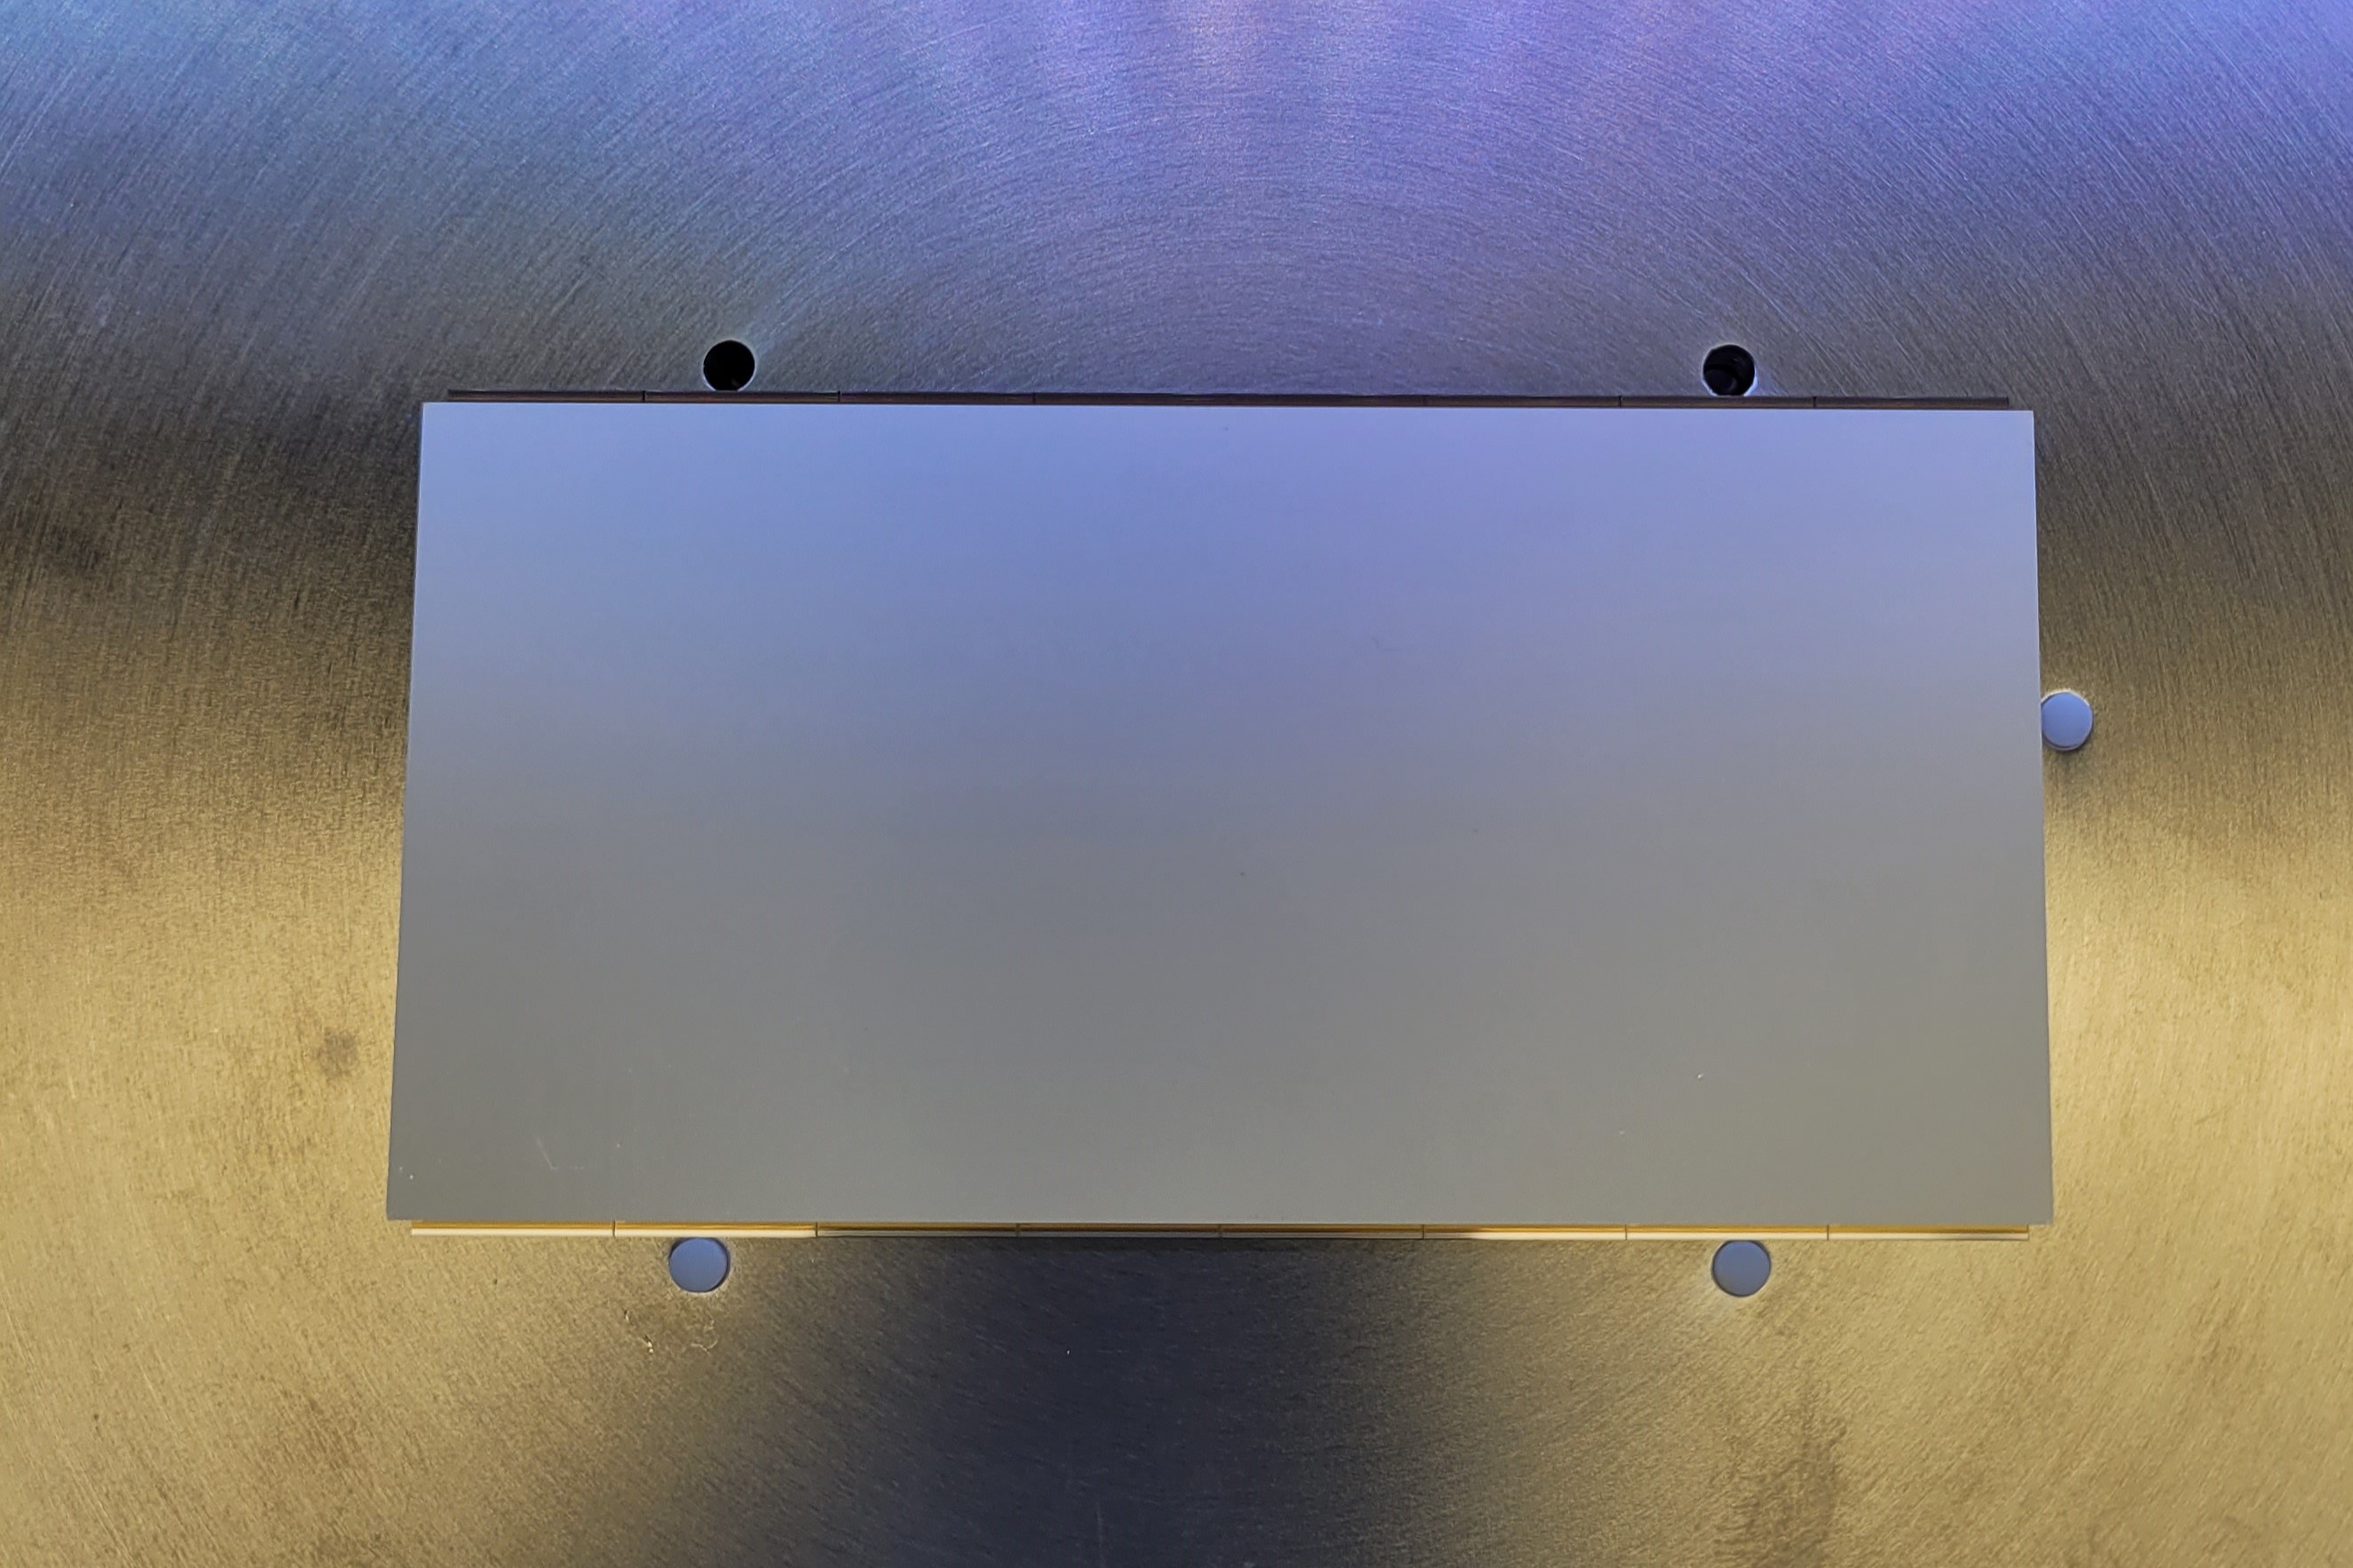
- Using the vacuum pen take the MaPSA and place it between the white pins on the chuck
- Close the compartment of the prober
- After that secure the MaPSA into the chuck by engaging the vacuum
Step 3: Setting up the Z-axis
- On the prober's computer select Home icon

- Lift the chuck by using the arrows in the Z setup
- Lift the chuck up until you see faintly the MaPSA and make sure that the needles are in the pads

Step 4: Alignment
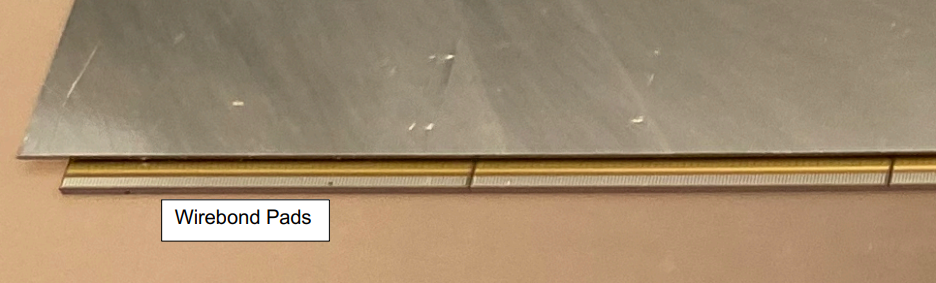
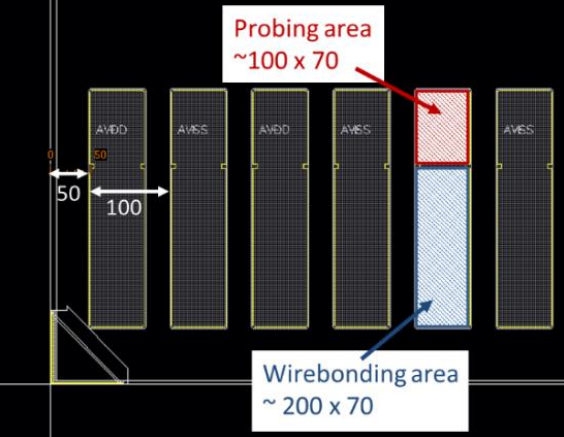
- MaPSA pads are divided in two sections:
- Wirebond area ~100μm x 70μm
- Probing area (closer to the sensor) ~200μm x 70μm
- To align the prober:
- Select the Manual Alignment button
- Select two corners in the pads to align the MaPSA
- Now that the prober is aligned with the pads of the MaPSA, position the crosshair on top of the previous probing marks on the pads.
- Sometimes is required to adjust the needles
- You can see where the needles are making contact by adjusting the focus of the microscope
- You can move side to side using the back dial from the microscope
Aligning the crosshair
- If the crosshair is not in the same position as the center of the first needle move the microscope using the knobs in the back of it.
- The inner one moves the microscope side to side
- The outer one moves the microscope up and down
- Make sure to align it to the center of the first needle after making contact for an easier alignment experience
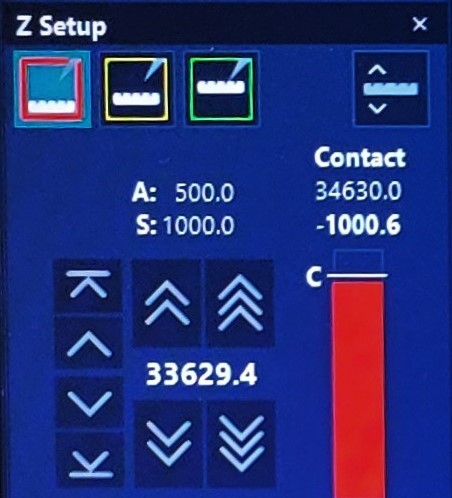
Step 5: Make contact
- Lower the needles using
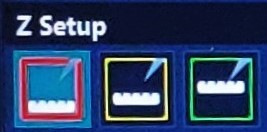 on the Z Setup
-
Red box:No contact -
Yellow box:Before contact -
Green box: Contact
-
Step 6: Fill in the info
- There is two different vendors that supplies the MaPSAs
- Hamamatsu
- QPT
To identify the vendors:
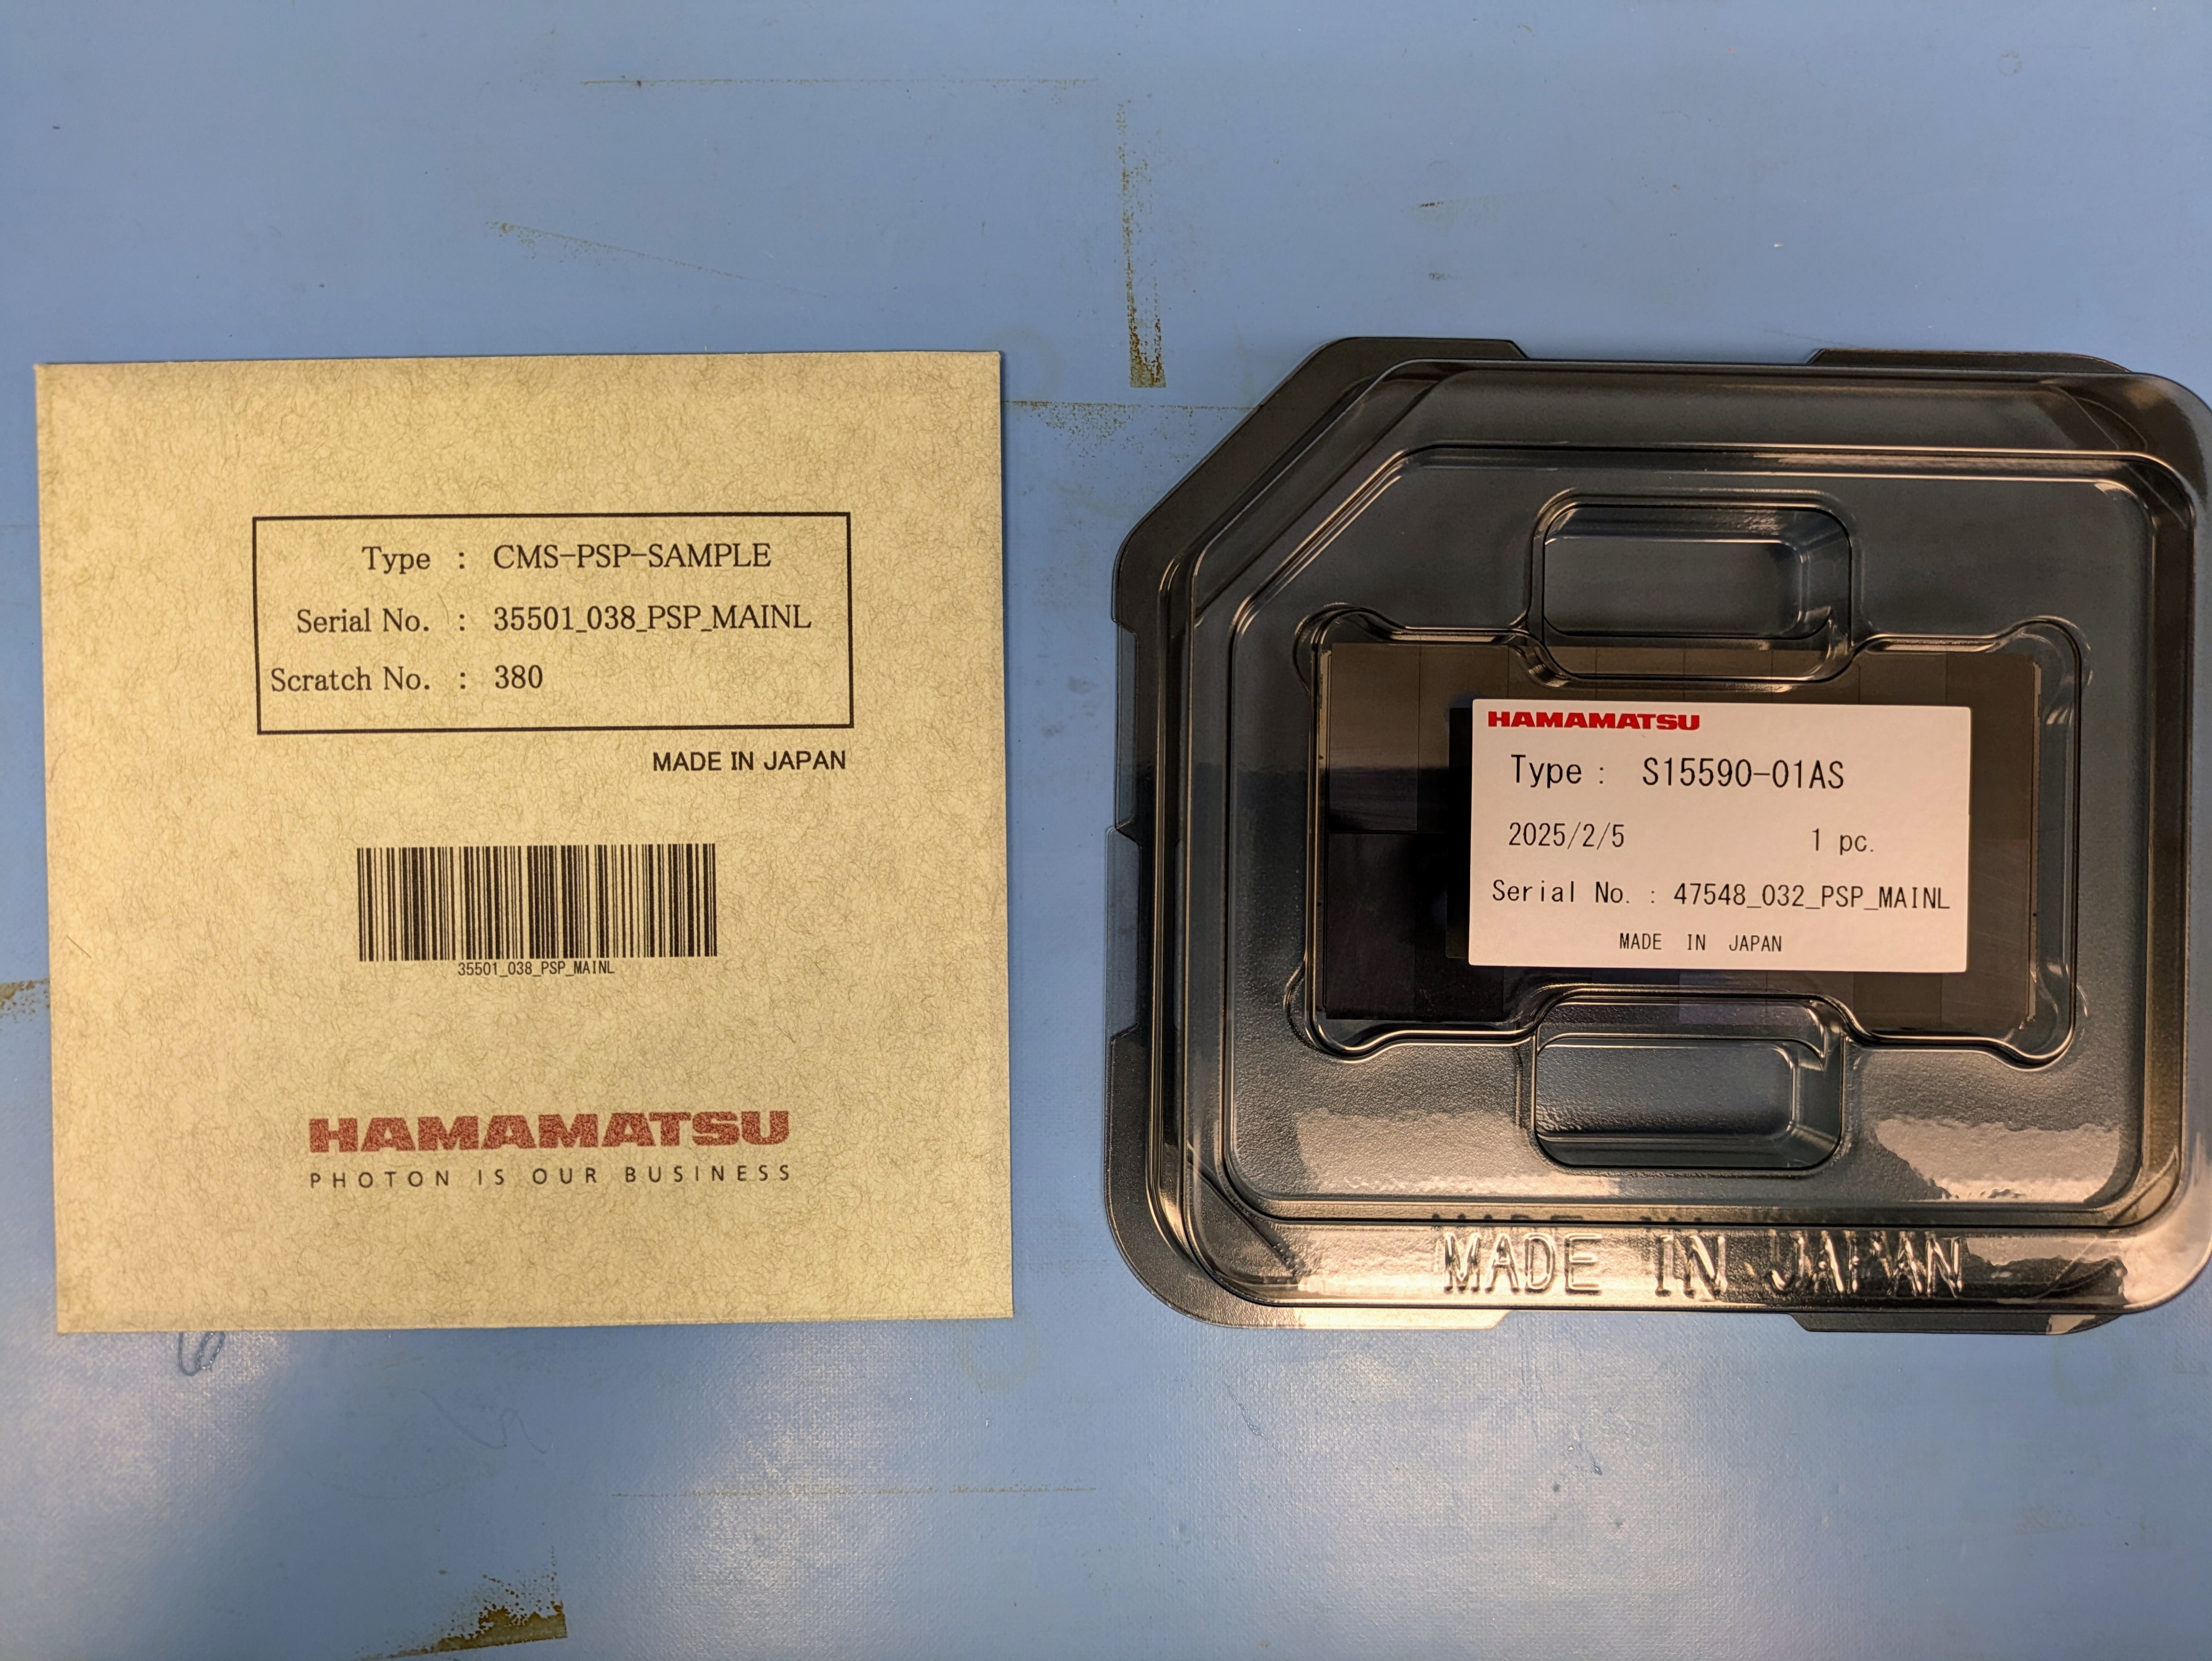
- Envelope: QPT
- Case cover: Hamamatsu HPK
- On MaPSA ID:
HPK_XXXXX_XXX[X] (If its Hamamatsu)
QPT_XXXXX_XXX[X] (If its QPT)
- The final character being the letter of the side of the MaPSA (Left or Right)
- On the MPA box fill in the number of the current MPA being tested.
-
Notethat each time the user finish testing one MPA and moves the needles to the next MPA, the user has to change this number manually, otherwise it WILL overwrite the data
-
Step 7: Run the initial tests
- Click on
Power Onbutton - On the terminal you should see something like this
-> SSA enabled -> MPA enabled ---> Enabling the MPA SSA Board I2C master ---> Enabling the MPA SSA Board I2C master -> Sent Hard-Reset pulse -> P_dig: 74.130mW [V= 0.983V - I= 75.450mA] -> P_ana: 71.609mW [V= 1.222V - I= 58.600mA] -> P_pad: 9.840mW [V= 1.230V - I= 8.000mA] -> Total: 155.579mW [ I=142.050mA] ... more stuff ... Line Status: Tuning done/applied: 1 Line ID: 5, Idelay: 5, Bitslip: 6, WA FSM State: 14, PA FSM State: 14 Line Status: Tuning done/applied: 1 Line ID: 5, Idelay: 5, Bitslip: 6, WA FSM State: 14, PA FSM State: 14 -> Initialised SLVS pads and sampling edges -> Sampling phases tuned -> Activated normal readout mode - If the contact is not good, you will get an output with the Total Power and current numbers off by 10-20 mW or even 100mW!
- Additionally it can output an error
- Check the Troubleshoot for help
- Additionally it can output an error
- After this, click
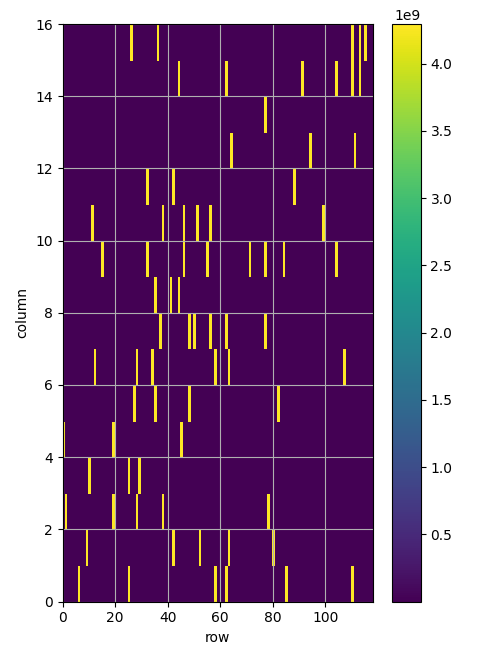
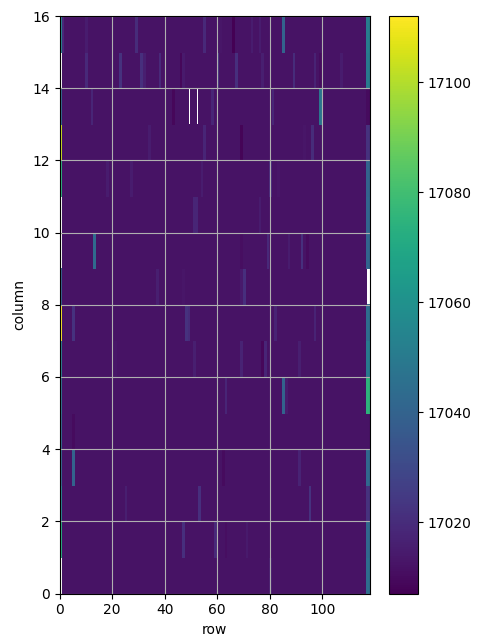
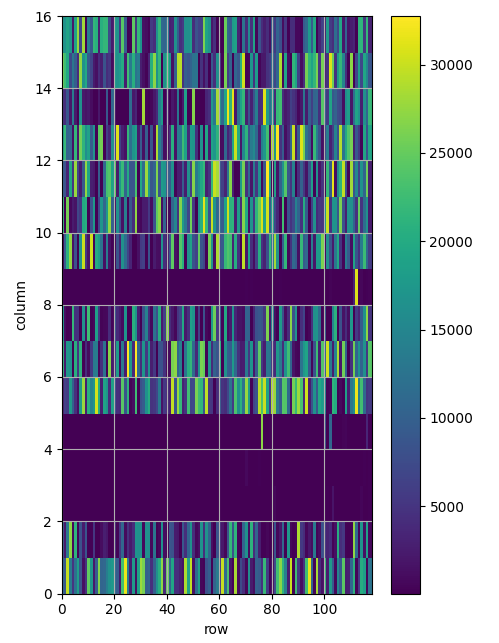
Pixel Alive - This will generate a plot with the status of the pixel and if it has noise or other problem with it (Operational)
Step 8: Run MPA test
- The Pixel Alive should be 100 in the heat map
- After this run the
IV Scan- This takes ~8 minutes
- After it finishes, go to
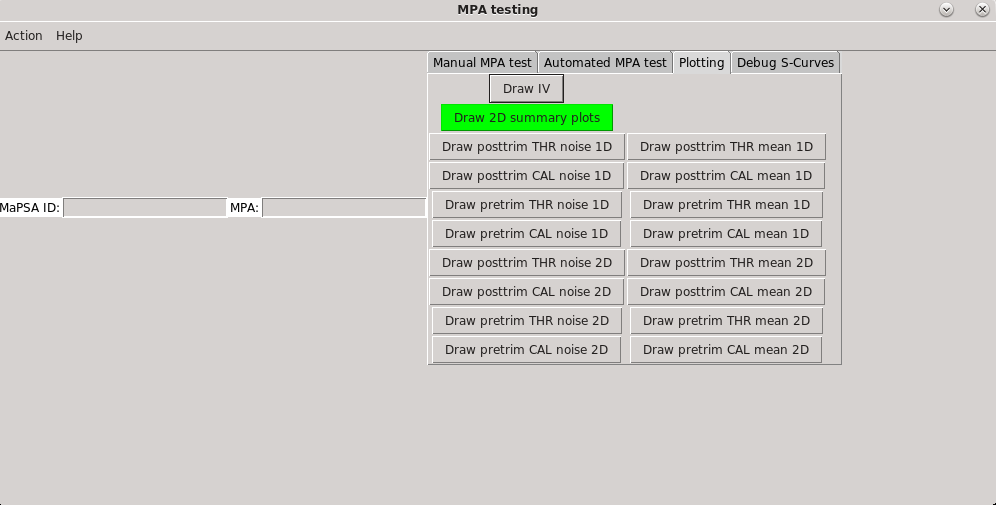
Plottingtab and click onDraw IV- This test runs up to -800V and as voltage goes up, the current goes up (Ohm’s Law)
- An example of the first voltage and current taken and last
-
Voltage Current -10.00 -0.09 -800.00 -0.35
Step 9: Run MPA test
- Go back to the
Manual MPA testtab and clickTest 1 MPA- Check if the
Power Onis active
- Check if the
- This will test:
- Wafer test
- Mask/Alive
- Pretrim S
- Prosttrim S
- Bad Bump
- This test should take ~4.5 minutes (for each MPA)
- After it finishes, click
Plottingtab
- Click
Draw 2D summary plots - This will plot the current and previous MPA tested
- Check if the data is sensible, if so, then repeat
Step 4-Step 5andStep 9
Step 10: Test the other half
To test the other half (MPAs 9 - 16) the MaPSA has to be rotated.
- Set the chuck for removal on Material Handling

- Take out the chuck
- Turn off vacuum
-
Carefully rotate the MaPSA as shown:
- Repeat
Step 2-Step 5andStep 7-Step 9 -
Very IMPORTANT:
Remember to change the MPA # for each run
Troubleshoot 🛠️
⁉️ Lost, and don’t know which MPA you were at?
- Between each MPA there is 12mm
- Guide for X position vs MPA
| MPA First Half | MPA Second Half | X Position |
|---|---|---|
| 1 | 9 | 00000.0 μm |
| 2 | 10 | 12000.0 μm |
| 3 | 11 | 24000.0 μm |
| 4 | 12 | 36000.0 μm |
| 5 | 13 | 48000.0 μm |
| 6 | 14 | 60000.0 μm |
| 7 | 15 | 72000.0 μm |
| 8 | 16 | 84000.0 μm |
⚠️ Error: After Pixel Alive
pyvisa.error.VisaIOError: VI_ERROR_RSRC_BUSY (-1073807246): The resource is valid, but VISA cannot currently access it.
![]() Solution: USB connection error
Solution: USB connection error
- Disconnect the white long USB Type A (on the floor)
- Reconnect USB
- Try again Pixel Alive
⚠️ Error: No plot after Pixel Alive and the following error:
Line Status:
  Tuning done/applied: 0
  Line ID: 4,   Idelay: 15,   Bitslip: 7,   WA FSM State: 13,   PA FSM State: 14
Line Status:
  Tuning done/applied: 0
  Line ID: 4,   Idelay: 15,   Bitslip: 7,   WA FSM State: 13,   PA FSM State: 14
Failed tuning line 4
Line Configuration:
  Line ID: 5,   Mode: 0,    Master line ID: 0,    Idelay: 0,    Bitslip: 0
Line Status:
  Tuning done/applied: 0
  Line ID: 5,   Idelay: 0   Bitslip: 0    WA FSM State: 0   PA FSM State: 12

Line Status:
  Tuning done/applied: 0
  Line ID: 5    Idelay: 0   Bitslip: 0,   WA FSM State: 0,    PA FSM State: 12
Line Status:
  Tuning done/applied: 0
  Line ID: 5,   Idelay: 0,  Bitslip: 0,   WA FSM State: 0,    PA FSM State: 12
Failed tuning line 5
-> Initialised SLVS pads and sampling edges
-> Sampling phases tuned
-> Activated normal readout mode
('ASRL1: : INSTR', 'ASRL2 : : INSTR', 'ASRL3: : INSTR', "ASRL4: : INSTR')

KEITHLEY INSTRUMENTS INC.,MODEL 2410,4457440, C34 Sep 21 2016 15:30:00/A02 /K/M
Fail: 2
Fail: 2
Exception in Tkinter callback
Traceback (most recent call last):
  File "/usr/lib64/python3.6/tkinter/_init_.py", line 1705, in__call__
    return self.func(*args)
  File "/home/jluo/Documents/MaPSA/MaPSA_Testing/MPA2_Testing/MPA2_Test/main.py", line 425, in pa
    pixel_alive = mpa.cal.pixel_alive(ref_cal=cal, ref_thr=thr, pulse_delay=delay, plot=1)
  File "/home/jluo/Documents/MaPSA/MaPSA_Testing/MPA2_Testing/MPA2_Test/mpa_methods/mpa_cal_utility.py", line 334, in pixel alive
    tempnom = self.conf.convertRawToNomPixmap(temp)
  File "/home/jluo/Documents/MaPSA/MaPSA_Testing/MPA2_Testing/MPA2_Test/myScripts/mpa_configurations.py", line 74, in convertRawToNomPixmap
    nomdata.append(data[p])
TypeError: 'int' object is not subscriptable
![]() Solution: Bad connection
Solution: Bad connection
- Press Power Off on the GUI to power off the MPA
- Reposition the needles (no more than 5µm in X or Y) and try again.
Other examples of bad connection: